@rafapereirabr gtfsrouter now has a new turbo-charged gtfs_traveltimes function, largely motivated by the support of the Mobility Institute Berlin, and the outstanding input of @AlexandraKapp. This issue is intended to document first comparisons against equivalent times generated from your amazing r5r package.
Disclaimer: r5r is a truly general package able to do what it says, "Realistic Routing on Real-world and Reimagined networks." gtfsrouter in comparison is just a routing package for the mode = "TRANSIT" component only, and so has comparably much more restricted functionality than r5r.
Additional notes:
- The
r5r results in the following reprex were pre-generated using the same GTFS feed for the "Verkehrsverbund Berlin Brandenburg" (VBB), Germany. Both queries were run for a Tuesday (8th Dec 2020).
gtfsrouter has a function to expand transfer tables provided with feeds, to enable more realistic, and more extended, pedestrian transfers between stops, analogous to the additional pedestrian routing offered by r5. This is implemented below in the lines starting with gtfs_transfer_table(), which has a default upper time limit of 120 seconds.
library (gtfsrouter)
packageVersion("gtfsrouter")
#>[1] '0.0.4.160'
gtfs <- extract_gtfs("vbb.zip")
#> ▶ Unzipping GTFS archive
#> ✔ Unzipped GTFS archive
#> ▶ Extracting GTFS feed✔ Extracted GTFS feed
#> ▶ Converting stop times to seconds✔ Converted stop times to seconds
#> ▶ Converting transfer times to seconds✔ Converted transfer times to seconds

transfers <- gtfs_transfer_table (gtfs, network_times = FALSE)
library (dplyr)
transfers <- gtfs$transfers %>%
    select(.data$from_stop_id, .data$to_stop_id, .data$transfer_type, .data$min_transfer_time) %>%
    rbind(transfers) %>%
    group_by(.data$from_stop_id, .data$to_stop_id) %>%
    summarise(across(everything(), first)) %>% # take min_transfer_time from gtfs$transfers if present
    data.table::data.table()
gtfs$transfers <- transfers
gtfs <- gtfs_timetable(gtfs, day = "tuesday")
from <- "Berlin Hauptbahnhof"
start_time <- 8 * 3600
system.time (
    iso <- gtfs_traveltimes (gtfs, from, start_time)
    )
#>    user  system elapsed
#>   1.001   0.003   0.942
iso$duration <- as.integer (iso$duration)

library(r5r)
path <- "<path-to-OSM-and-GTFS-data-for-Berlin>"
r5r_core <- setup_r5(data_path = path)
p <- data.frame (name = gtfs$stops$stop_name,
    id = gtfs$stops$stop_id,
    lon = gtfs$stops$stop_lon,
    lat = gtfs$stops$stop_lat)
o <- p [grep ("Berlin Hauptbannhof", p$name), ]
mode <- c ("WALK", "TRANSIT")
departure_datetime <- as.POSIXct ("2020-12-08 08:00:00",
    format = "%Y-%m-%d %H:%M:%S")
system.time (
    r5 <- travel_time_matrix (r5r_core = r5r_core,
                              origins = o,
                              destinations = p,
                              mode = mode,
                              departure_datetime = departure_datetime,
                              max_walk_dist = 500,
                              max_trip_duration = 180)
)
#>    user  system elapsed
#>   23.847   0.161   8.005

library (dplyr)
r5 <- group_by (r5, toId) %>%
    summarise (travel_time = min (travel_time))
r5 <- r5 [which (r5$toId %in% iso$stop_id), ]
index <- match (r5$toId, iso$stop_id)
iso$r5 [index] <- r5$travel_time * 60 # r5 returns travel time in minutes
iso <- iso [which (!is.na (iso$r5)), ]
# iso has one outlier:
iso <- iso [iso$duration < max (iso$duration), ]

duration <- iso$duration
r5 <- iso$r5
par (mfrow = c (1, 2))
cols <- c ("gray70", "gray20")
plot (duration, r5, type = "p", pch = 1, col = cols [1],
      xlab = "gtfsrouter times", ylab = "r5r times")
lines (range (duration), range (duration), col = cols [2], lwd = 2)
mod <- lm (r5 ~ duration + 0)
new <- data.frame (duration = range (duration))
fit <- predict (mod, newdata = new)
lines (new$duration, fit, col = cols [2], lwd = 2, lty = 2)
legend ("topleft", col = cols [2], lwd = 2, lty = 1:2,
        legend = c ("1:1", "linear fit"), bty = "n")

tdiff <- r5 - duration
hh <- hist (tdiff / 60, breaks = 50, plot = FALSE)
plot (hh$mids, hh$density, "l", col = cols [1], lwd = 2,
      xlab = "r5 times - gtfsrouter times (minutes)",
      ylab = "density")
lines (c (0, 0), c (0, 1), col = cols [2], lwd = 2)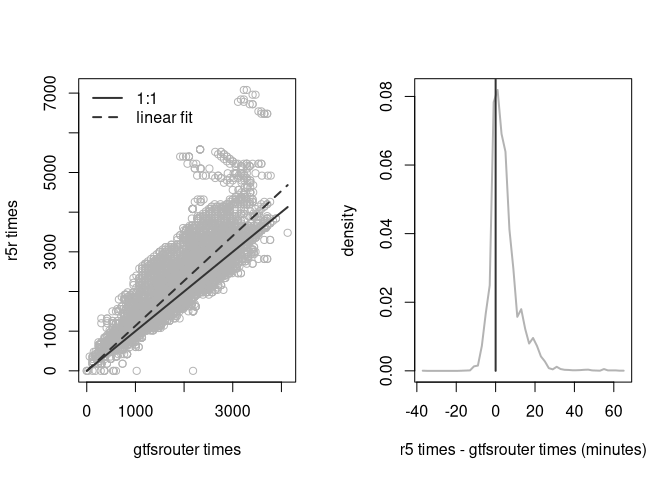
message ("r5 estimates take ",
         round (100 * (mod$coefficients [1] - 1), 1), "% longer")
#> r5 estimates take 13.4% longer
message ("(mean, median) difference in times = (",
         hms::hms (round (mean (tdiff))), ", ",
         hms::hms (median (tdiff)), ")")
#> (mean, median) difference in times = (00:04:46, 00:03:12)
Created on 2021-01-27 by the reprex package (v0.3.0)
Conclusions
gfsrouter calculates full travel times to > 13,000 stations in < 1 second, whereas r5r takes around 8 seconds to reach around 11,000 of those stations.gtfsrouter generates travel times that are around 13% quicker than r5r.
Why might the travel times be so much faster? My suspicion at present would be because r5, and so r5r by direct extension, uses an implementation of the raptor algorithm . As discussed in #61, the raptor algorithm only finds routes between successive "optimal" end-points, and so excludes the possibility of the optimal route to some end-point actually requiring intermediate travel along sub-optimal routes. In contrast, the new algorithm implemented here traces all possible routes between all pairs of stops, whether optimal or not, and only determines optimal routes once the algorithm has finished tracing the entire timetable. My hypothesis would be that the differences observed above primarily reflect this difference, and particularly the inability of raptor to use sub-optimal intermediate routes.
@rafapereirabr
gtfsrouternow has a new turbo-chargedgtfs_traveltimesfunction, largely motivated by the support of the Mobility Institute Berlin, and the outstanding input of @AlexandraKapp. This issue is intended to document first comparisons against equivalent times generated from your amazingr5rpackage.Disclaimer:
r5ris a truly general package able to do what it says, "Realistic Routing on Real-world and Reimagined networks."gtfsrouterin comparison is just a routing package for themode = "TRANSIT"component only, and so has comparably much more restricted functionality thanr5r.Additional notes:
r5rresults in the followingreprexwere pre-generated using the same GTFS feed for the "Verkehrsverbund Berlin Brandenburg" (VBB), Germany. Both queries were run for a Tuesday (8th Dec 2020).gtfsrouterhas a function to expand transfer tables provided with feeds, to enable more realistic, and more extended, pedestrian transfers between stops, analogous to the additional pedestrian routing offered byr5. This is implemented below in the lines starting withgtfs_transfer_table(), which has a default upper time limit of 120 seconds.Created on 2021-01-27 by the reprex package (v0.3.0)
Conclusions
gfsroutercalculates full travel times to > 13,000 stations in < 1 second, whereasr5rtakes around 8 seconds to reach around 11,000 of those stations.gtfsroutergenerates travel times that are around 13% quicker thanr5r.Why might the travel times be so much faster? My suspicion at present would be because
r5, and sor5rby direct extension, uses an implementation of theraptoralgorithm . As discussed in #61, the raptor algorithm only finds routes between successive "optimal" end-points, and so excludes the possibility of the optimal route to some end-point actually requiring intermediate travel along sub-optimal routes. In contrast, the new algorithm implemented here traces all possible routes between all pairs of stops, whether optimal or not, and only determines optimal routes once the algorithm has finished tracing the entire timetable. My hypothesis would be that the differences observed above primarily reflect this difference, and particularly the inability ofraptorto use sub-optimal intermediate routes.